Point and Figure Charts
Hi again,
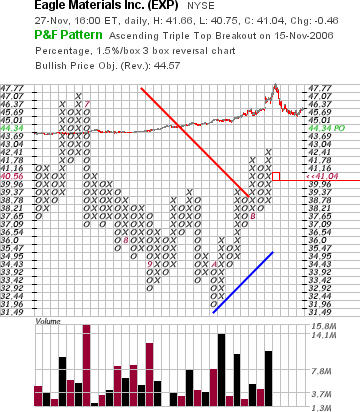
as usual, we will look at our stock picks from last week. First we have our "horror"trade EXP. It did not turn out to be what I expected. So, you should be out of this option trade. It might climb again - but I doubt that it will make the 45$ within the next two weeks. These days I am trying to digg into the Point and Figure charting. I never used it and I really don´t know much about it. Anyhow, I read a bit and, using a 3box reversal chart, box size 1,5%, would result in the price goal of 44.57$ - if it should rise. This is pretty close to our 45$, but not close enough. Here is my first P+F chart:
Next one: CWTR - did it close the Gap? No! Instead it was sold at 27.80$, leaving us with a loss of -2,1%. But, it still looks promising... Oh well.
Here are some new ideas:
1. ORCC - last price was 10.33$. We have a nice hammer, but my SL is at 10.15$, a little below the PivotPoint. First target at 11$. The chart:

2. Another hammer on CXG - this time to go short. Last price: 26.58$, first goal: in the area of 23.90$, SL at 27.60$. The chart:

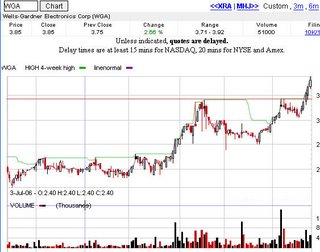
3. WGA - last price: 3.85$, SL at 3.55$ (4week high!), first target: open. Nice chart:
Good luck,
The Stockinvestigator
as usual, we will look at our stock picks from last week. First we have our "horror"trade EXP. It did not turn out to be what I expected. So, you should be out of this option trade. It might climb again - but I doubt that it will make the 45$ within the next two weeks. These days I am trying to digg into the Point and Figure charting. I never used it and I really don´t know much about it. Anyhow, I read a bit and, using a 3box reversal chart, box size 1,5%, would result in the price goal of 44.57$ - if it should rise. This is pretty close to our 45$, but not close enough. Here is my first P+F chart:
Next one: CWTR - did it close the Gap? No! Instead it was sold at 27.80$, leaving us with a loss of -2,1%. But, it still looks promising... Oh well.
Here are some new ideas:
1. ORCC - last price was 10.33$. We have a nice hammer, but my SL is at 10.15$, a little below the PivotPoint. First target at 11$. The chart:

2. Another hammer on CXG - this time to go short. Last price: 26.58$, first goal: in the area of 23.90$, SL at 27.60$. The chart:

3. WGA - last price: 3.85$, SL at 3.55$ (4week high!), first target: open. Nice chart:

Good luck,
The Stockinvestigator
Labels: Point+Figure, resume, TradingIdeas
posted by The Stockinvestigator at 2:30 PM
![]()
![]()

0 Comments:
Post a Comment
<< Home