Happy Halloween
Hi to all of you out there,
a Happy Halloween. It has been a while since my last post - but I was short on time - and, it does not look much better this week. However, I don´t want to leave you without some ideas to trade!
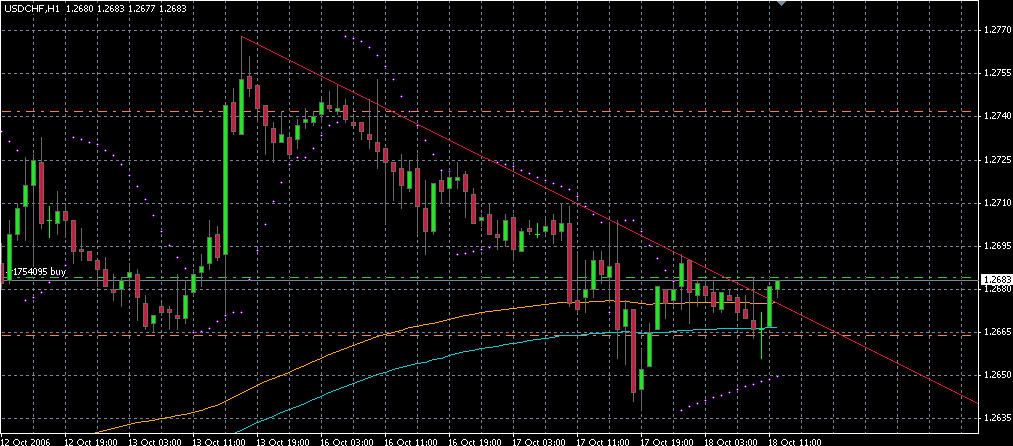
FOREX: I see an increasing downward trend on the EURUSD - this might be agood chance to go short. Currently at 1.2693, I would set my StopSell at 1.2690 - my longterm goal is in the area between 1.2590 and 1.2570 (support). As soon as price touches that area, I would sell. My SL for this trade would be placed at 1.2710 (20 Pips). Try to trail SL if trade goes in right direction.
Stocks:
1) EXFO - chart has built an inside day pattern, as I call it - good trade for today, last price was 5.09$, SL would be at 4.95$ (it is much lower than the PivotPoint - but I like to have a bigger range!)
2) RMTR - a candidate for a possible bounce - last price was 3.67$, SL at 3.50$
So much for today, no pics, I am sorry. Have a good day, till tomorrow,
The Stockinvestigator
a Happy Halloween. It has been a while since my last post - but I was short on time - and, it does not look much better this week. However, I don´t want to leave you without some ideas to trade!
FOREX: I see an increasing downward trend on the EURUSD - this might be agood chance to go short. Currently at 1.2693, I would set my StopSell at 1.2690 - my longterm goal is in the area between 1.2590 and 1.2570 (support). As soon as price touches that area, I would sell. My SL for this trade would be placed at 1.2710 (20 Pips). Try to trail SL if trade goes in right direction.
Stocks:
1) EXFO - chart has built an inside day pattern, as I call it - good trade for today, last price was 5.09$, SL would be at 4.95$ (it is much lower than the PivotPoint - but I like to have a bigger range!)
2) RMTR - a candidate for a possible bounce - last price was 3.67$, SL at 3.50$
So much for today, no pics, I am sorry. Have a good day, till tomorrow,
The Stockinvestigator
Labels: TradingIdeas
posted by The Stockinvestigator at 11:09 AM
0 comments
![]()
![]()